400 186 1886


一、項目介紹
最近做項目,甲方要求在柱狀圖里加上水波圖的效果,真是太有趣了,太有創意啦。馬上動手實現。
思路
echart提供了一個renderItem方法,可以幫助我們自定義每個series的配置。我們分析柱狀圖跟水波圖,就是由一個矩形跟一個波浪路徑組成,因此我們可以返回一個圖形數組來表現當前項。
二、了解renderItem
renderItem 函數是自定義系列的核心,它負責將數據項(dataItem)轉換為可視化的圖形元素。ECharts 會為 series.data 中的每個數據項調用一次 renderItem 函數。主要優勢在于:
- 可以自由繪制各種圖形元素
- ECharts 會自動管理圖形的創建、刪除、動畫等細節
- 可以與其他組件(如 dataZoom、visualMap)無縫聯動
參數
renderItem 函數接收兩個參數:params 和 api
//params 包含當前數據信息和坐標系信息:
{
    context: {},       // 可供開發者暫存東西的對象
    seriesId: string,  // 本系列 ID
    seriesName: string, // 本系列名稱
    seriesIndex: number, // 本系列索引
    dataIndex: number,  // 數據項在原始數據中的索引
    dataIndexInside: number, // 數據項在當前可見數據窗口中的索引
    dataInsideLength: number, // 當前可見數據長度
    coordSys: {        // 坐標系信息,類型不同結構也不同
        type: 'cartesian2d' | 'polar' | 'geo' | 'calendar' | 'singleAxis',
        // 不同坐標系下的具體屬性...
    }
}
api 參數提供了一系列方法:
api.value(index)- 獲取數據項中指定維度的值api.coord(valueArray)- 將數據值轉換為坐標系上的點api.size(valueArray)- 獲取坐標系上一段數值范圍對應的像素長度api.style(styleOverrides)- 獲取或覆蓋默認樣式
返回值
renderItem 函數需要返回一個圖形元素定義對象
{
    type: string,       // 圖形類型,如'rect','circle','sector','polygon'等
    shape: object,      // 圖形形狀定義
    style: object,      // 圖形樣式
    extra: object,      // 額外信息,可在事件處理器中訪問
    children: array,    // 子圖形(當type為'group'時)
    // 其他可選屬性...
}
三、實現
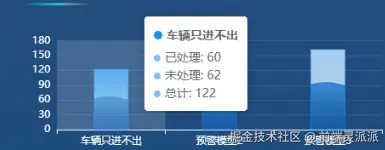
首先要實現基本配置,柱子的高度為數據的總數,水波的位置為已處理數據,提示窗展示名稱、已處理、未處理、總數等數據。
// 數據配置 - 包含已處理和未處理的數據
const chartData = [
  { name: "車輛只進不出", processed: 60, unprocessed: 62, total: 122 },
  { name: "預警模型2", processed: 72, unprocessed: 82, total: 154 },
  { name: "預警模型3", processed: 71, unprocessed: 91, total: 162 }
];
// 創建水波柱狀圖配置
const createOption = () => {
  return {
    backgroundColor: 'transparent', //echart背景為透明
    animation: false,
    tooltip: { //提示窗配置
      trigger: 'axis',
      axisPointer: {
        type: 'shadow'
      },
      formatter: function(params) {
        const data = chartData[params[0].dataIndex];
        return `${params[0].name}<br/>已處理: ${data.processed}<br/>未處理: ${data.unprocessed}<br/>總計:${data.total}`;
      }
    },
    grid: { //圖表位置占比配置,盡量居中
      left: '3%',
      right: '4%',
      bottom: '12%',
      top:'5%',
      containLabel: true
    },
    xAxis: {  //配置x軸
      type: 'category',
      data: chartData.map(item => item.name),
      axisLabel: {
        color: '#fff',
        fontSize: 12
      },
      axisLine: {
        lineStyle: {
          color: '#fff'
        }
      }
    },
    yAxis: { //配置y軸
      type: 'value',
      axisLabel: {
        color: '#fff',
        fontSize: 12,
      },
      axisLine: {
        lineStyle: {
          color: '#fff'
        }
      },
      splitLine: {
        lineStyle: {
          color: 'rgba(255, 255, 255, 0.1)'
        }
      }
    },
    series:series //配置數據項
  };
};
自定義數據項,通過rederItem方法返回一個矩形跟一個波浪路徑
// 水波動畫時間
let animationTime = 0;

let series = [
{
    name: '水波柱狀圖',
    type: 'custom',
    renderItem: (params, api) => {
      const categoryIndex = api.value(0); //當前項索引
      const totalValue = api.value(1); //當前項的值
      const processedValue = chartData[categoryIndex].processed; //已完成的值

      const start = api.coord([api.value(0), 0]); //開始的坐標位置,返回[x,y]坐標
      const end = api.coord([api.value(0), totalValue]); //結束的坐位位置
      const height = end[1] - start[1]; //高度
      const width = 40; //寬度

      const rectShape = {  //定義矩形的形狀
        x: start[0] - width / 2,
        y: start[1],
        width: width,
        height: height
      };

      // 計算水波位置 - 基于已處理數量占總數的比例
      const waterLevel = processedValue / totalValue;
      const wavePath = createWavePath(rectShape, waterLevel, animationTime);

      return { //返回值
        type: 'group',
        children: [
          {
            type: 'rect',  //矩形
            shape: rectShape,
            style: {
              fill: {
                  type: 'linear',
                  x: 0,
                  y: 0,
                  x2: 0,
                  y2: 1,
                  colorStops: [
                    { offset: 0, color: 'rgba(24, 144, 255, 0.8)' },
                    { offset: 0.5, color: 'rgba(64, 169, 255, 0.6)' },
                    { offset: 1, color: 'rgba(9, 109, 217, 0.4)' }
                  ]
                },
              stroke: 'rgba(24, 144, 255, 0.3)',
              lineWidth: 1
            }
          },
          {
            type: 'path',  //水波路徑
            shape: {
              pathData: wavePath
            },
            style: {
              fill: {
                type: 'linear',
                x: 0,
                y: 0,
                x2: 0,
                y2: 1,
                colorStops: [
                  { offset: 0, color: 'rgba(24, 144, 255, 0.8)' },
                  { offset: 0.5, color: 'rgba(64, 169, 255, 0.6)' },
                  { offset: 0.5, color: 'rgba(64, 169, 255, 0.6)' },
                  { offset: 1, color: 'rgba(9, 109, 217, 0.4)' }
                ]
              }
            },
            z: 10
          }
        ]
      };
    },
    data: chartData.map(item => item.total),
    z: 10
  }
]
實現水波的方法,生成一個svg的路徑。SVG 路徑字符串是描述矢量圖形的重要方式,下面我將詳細介紹如何生成 SVG 路徑字符串
基本 SVG 路徑命令
| 命令 | 含義 | 示例 |
|---|---|---|
| M | 移動到 (MoveTo) | M 10,20 |
| L | 直線到 (LineTo) | L 30,40 |
| C | 三次貝塞爾曲線 (Cubic Bezier) | C x1,y1 x2,y2 x,y |
| Q | 二次貝塞爾曲線 (Quadratic Bezier) | Q x1,y1 x,y |
| Z | 閉合路徑 (ClosePath) | Z |
// 創建水波路徑
const createWavePath = (rect, waterLevel, time) => {
  const { x, y, width, height } = rect;
  const waterHeight = height * waterLevel; //水波的高度=柱子高度*百分比
  const waterY = y + height - waterHeight; //水波的y軸位置

  const waveLength = width;
  const waveHeight = 3;
  const frequency = 1;

  // 從底部開始繪制路徑
  let path = `M ${x} ${y + height}`;

  // 繪制左側邊線到水波位置
  path += ` L ${x} ${waterY}`;

  // 繪制水波頂部
  for (let i = 0; i <= width; i += 2) {
    const waveX = x + i;
    // 使用正弦函數計算Y坐標
    const waveY = waterY + Math.sin((i / waveLength) * Math.PI * frequency + time) * waveHeight;
    path += ` L ${waveX} ${waveY}`;
  }

  // 繪制右側邊線回到底部
  path += ` L ${x + width} ${y + height}`;

  // 閉合路徑
  path += ` Z`;

  return path;
};
創建echart圖標,并實現水波的動畫效果
// 創建圖表
const createChart = () => {
  const container = chartRef.value;
  chartInstance = echarts.init(container);

  chartInstance.setOption(createOption());

  // 啟動水波動畫
  const animate = () => {
    animationTime += 0.1;
    if (chartInstance) {
      chartInstance.setOption({series:series});
    }

    requestAnimationFrame(animate);
  };

  animate();
};

onMounted(() => {
  createChart();
});

onUnmounted(() => {
  if (chartInstance) {
    chartInstance.dispose();
    chartInstance = null;
  }
});
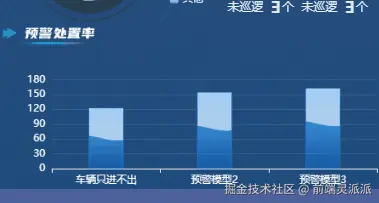
最終效果: